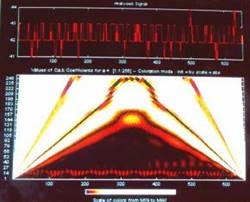
WAVELET
ANALYSIS OF HEART RATE VARIABILITY.
New Method of Studying the Heart's Function
Acharya
R*, Hegde BM* , Bhat PS**, Rao A*** and Niranjan UC.*
*
Manipal Academy of Higher Education (Deemed University) Manipal 576 119,India
** Karnataka Regional Engineering College, Surathkal, India
*** Indian Institute of Science, Bangalore
Correspondence: Prof. B. M. Hegde, VC, MAHE University Manipal-576 119.
India.
bmhegde@manipal.edu
Conventional
electrocardiogram is the sum total of the millions of cardiac cell depolarization
potentials. They are being recorded; using twelve surface leads (ECG),
based on the Einthovan's triangle principle. The whole process represents
just about a few seconds recording of the above mentioned potentials at
any given time. Many times the procedure is done over a period of a day
or two; the latter is called Holter monitoring. The graph is then interpreted
using linear mathematical rules. This complicated wave structure is artificially
split into parts, like the PR interval and ST segment etc. Linear calculations
do not hold good in any dynamic structure like the human heart, as such
these measurements are bound to go wrong when used to predict the future
of the patient. "Doctors have been predicting the unpredictable"
all these years was the observation of a physicist in a recent study.1
No organ of the human body works in isolation, although in reductionist
science, organ based specialties have developed to the detriment of patient
care! The various organs of the human body work in tandem having been
"mode-locked" to one another. Mode locking makes it possible
for the most dominant rhythm to control all other rhythms in the human
body. The most dominant rhythm is the rhythm of breathing. Heart rhythm
is, therefore, mode-locked to breathing. This could be made out in children
even by the nurse, called sinus arrhythmia, wherein the pulse goes fast
during inspiration and slows down during expiration. However, this becomes
less marked as age advances. If one could analyze the heart rhythm more
carefully using non-linear methods, one sees this happening even right
up to the time of death. The intensity varies depending on the health
of the whole system. Heart rate variability (HRV) is one such measure
that gives a good indication of the health of the cardiovascular system.
We have gone a step further in this study. Instead of analyzing the whole
wave pattern, we have studied the wavelet analysis. The latter is much
more accurate measure of the ECG pattern. Coupled with mode locking, represented
by HRV, wavelet analysis could assess the heart's function much more accurately.
This enables better prediction of the future events possible, although
predicting the future with one hundred per cent accuracy in a dynamic
organism needs the total initial knowledge of the organism.2 The latter
is hampered by our inability to assess the genotype and the consciousness
of the organism with our present knowledge.3
Materials and Methods:
A
total of 400 subjects, both apparently healthy ones and patients suffering
from various cardiac diseases have been studied using the methods described
below. The age and sex distribution is given in the table (1) below as
also the disease distribution with the total number studied under each
category is shown in the next table(2) The ECG data is stored in a holter
monitor for the duration of 10-15 minutes. Then this data is sampled at
a sampling rate of 131 sps? with a resolution of 12bits/sample and stored
in a random access file. R-R interval is then found out.4, 5
Continous
Time-Wavelet (CWT) Analysis
Wavelet
analysis is essentially comparing the signal with a chosen wavelet; and
recording the coefficients that indicate the correlation of the signal
to the wavelet. The reference function is called the mother wavelet, which
is appropriately dilated and translated to different scales before comparing
with the time domain signal.6, 7 The wavelet coefficients are plotted
against a two dimensional plane with one axis (y-axis) representing the
dilation (scaling factor) of the wavelet, and the other (x-axis), its
translation (shift along the time axis). The strength of the coefficients
themselves is shown by the intensity of a chosen color, so that the distribution
can be seen as color patterns in a two dimensional plane (scalogram).
In the Continuous time Wavelet Transform (CWT)8, 9, 10 the wavelet coefficients
are evaluated for infinitesimally small shifts of translation as well
as scale factors. That is, color intensity of each pixel is separately
evaluated, and therefore CWT scalogram is suitable to observe patterns
in the distribution of coefficients. This approach provides a more accurate
time localization of the abnormality or the defect in the signal. The
duration of the abnormality can be surmised from the dilation factor,
and its location by the translation factor. Thus the intensity and spread
of the color pattern can be useful in classification of abnormalities.
For
a given
wavelet
![]() , the
wavelet coefficients
are evaluated
as given
below:
, the
wavelet coefficients
are evaluated
as given
below:

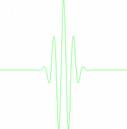
The patterns thus obtained are not unique, since it also depends upon the wavelet chosen for the analysis. The bio-signals usually exhibit a fractal like pattern in their distribution, and a wavelet which is akin to this fractal shape would yield the best results in terms of patterns. (For example, the Fourier analysis of a sine function is very clear and distinct – because the basis function as well as the signal are self similar ? whereas the Fourier analysis of a square wave spreads across infinite bandwidth. In the present work, Morlet wavelet is chosen as the basis function for analysis and its structure is shown below.
Fig.1 Plot of Morlet Function
Discrete Time - Wavelet (DWT) Analysis
The
evaluation of Continuous time Wavelet Transform (CWT) coefficients is
a highly computation intensive process . For each pixel in the scalogram
represents a wavelet coefficient, and this coefficient is the result of
a correlation algorithm. CWT is useful in signal analysis (to identify
the patterns). It is possible to synthesize the original signal from the
scalogram coefficients, but because of the high degree of computational
intensity, the CWT is generally not suitable for data compression.
Discrete time Wavelet Transform (DWT), is a sampled version of the CWT in a dyadic grid. In CWT every pixel of the scalogram represents a wavelet coefficient, but in DWT, the wavelet coefficients are calculated for discrete values of scale factor and translation factors – the increments are in the dyadic scale.11, 12 Consequently, it is called dyadic scalogram, and therefore has fewer coefficients than CWT. In DWT, a whole tile in the scalogram represents a single coefficient, and hence would be shown with the same intensity. Hence the pattern visible in the CWT plot is conspicuous from its absence in DWT plot. The argument in favor of the DWT is that, though it makes use of fewer coefficients than CWT, it is possible to synthesize the original signal using these coefficients. The computational economy makes it suitable for data compression and storage.
Nonlinear
Dynamical Analysis
Recent
developments in the theory of nonlinear dynamics have paved the way for
analyzing signals generated from nonlinear living systems. It is now generally
recognized that these nonlinear techniques are able to describe the processes
generated by biological systems in a more effective way. The nonlinear
dynamical techniques are based on the concept of chaos and it has been
applied to many areas including the areas of medicine and biology. The
theory of chaos has been used to detect some cardiac arrhythmias such
as ventricular fibrillation.13 Efforts have been made in determining nonlinear
parameters like correlation dimension for pathological signals and it
has been shown that they are useful indicators of pathologies. Methods
based on chaos theory have been applied in tracking HRV signals and predicting
the onset events such as ventricular tachycardia in many cardiac conditions.14
A novel method based on phase-space technique has been proposed for the
analysis of cardiovascular signals.15
Phase-
space
Phase
space is any abstract space formed by position (linear or angular) and
its associated speed. It is used by physicists to study the behaviour
of physical systems including chaotic systems.
If x-axis indicates the position of an object (value of x indicates the position at any particular instant), and the y-axis indicates its velocity (y = dx/dt ) corresponding to the position, then the resulting plot indicates the nature of its motion.
About
CD:
In
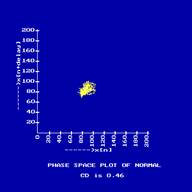
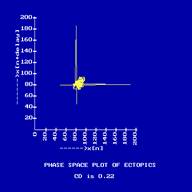
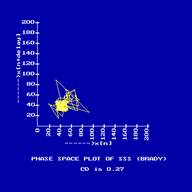
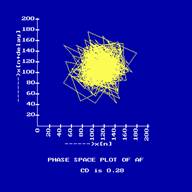
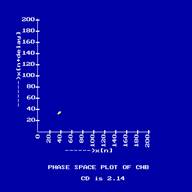
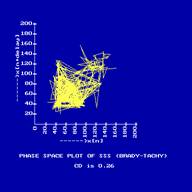
the phase space plot shown X axis represents the heartrate x(k) and the
Y axis represents the heartrate with a delay x(k+T). The choice of an
appropriate delay T was calculated using the minimal mutual information
technique.16, 17
It may be observed that the way in which the points are distributed depends on the structure of the signal which, in turn, depends on the condition of the subject.
The
method of estimating the embedding dimension for measured signals was
proposed by Grassberger and Procaccia.18 Other authors have verified that
the embedding theorem restriction is only a sufficient, but not necessary
condition for dynamic reconstruction.19 Nevertheless, the dimensionality
of the attractor is usually unknown for experimental data and required
embedding dimension is therefore unknown. In the present work an adequate
embedding dimension of 2 was chosen. This method also allows us to determine
the so called correlation dimension (CD) of the attractor which is computed
from the equation:
![]()
where
the correlation integral C (r ) is
given by
![]()
where
Xi
and Xj are
the points of the trajectory in the phase space, N is the number of
data points in phase space, the distance r is a radius around each
reference point Xi and
is the
Heaviside function. The CD is a measure of complexity of the process being
investigated.
Result :
| Type | Young (age <50) |
Old (age > 50) |
| Normal | 0.33 <=CD <=0.5 | Cd > 0.5 |
| Ectopics | 0.19 <= CD <= 0.3 | 0.3 <= Cd <= 0.33 |
| SSS 1 | 0.2 <= CD <= 0.3 | 0.3 <= CD <= 0.36 |
| AF | CD <= 0.3 | CD <= 0.3 |
| CHB | CD <= 0.8 | CD > 0.8 |
| SSS III | CD < 0.27 | CD >= 0.27 |
| Isc. /Dil. | 0.6 <= CD <=0.8 | Cd >0.8 |
Table
1 : The ranges of CD values for different types for various classes,
in each group a minimum of 10 subjects were analyzed.
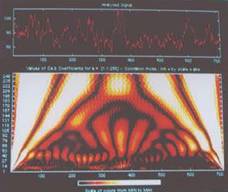
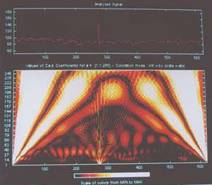
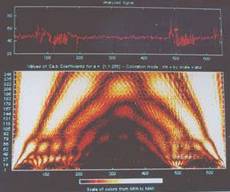
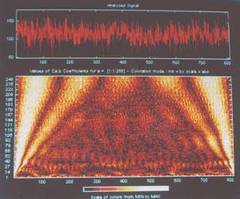
In
the CWT plot colors, yellow and white colors elicit high frequency variation
and black indicates low frequency variations.
The phase space plot of typical Normal heart rate is shown in Fig.2 and
its CWT is shown in Fig.3. In the CWT plot there is a continuous variation
in the colors indicating that the heart rate is continuously varying.
And its phase space plot is restricted to a range. The phase space plot
of Ectopics is shown in Fig. 4 and its CWT is shown in Fig.5. The ectopic
beat is a sudden surge of white line in the CWT plot. In the phase space
plot the range is stretched on one side. The phase space plot of SSS 1
(Sick Synus Syndrome) (BRADY) heart rate is shown in Fig.6 and its CWT
is shown in Fig.7. There are black patches indicating the brady syndrome.
In the phase space plot there is more variation. The phase space plot
of Atrial Fibrillation (AF) heart rate is shown in Fig.8 and its CWT is
shown in Fig.9. The variation of colors is sudden in the CWT indicating
there is sudden changes in the heart rates. The phase space plot is highly
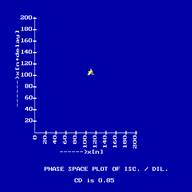
varying. The phase space plot of complete Heart Block (CHB) heart rate
is shown in Fig.10 and its CWT is shown in Fig.11. The color variation
in CWT is very subtle, indicating that the heart rate variation is very
less. And in the phase space plot, we get a almost a point. The phase
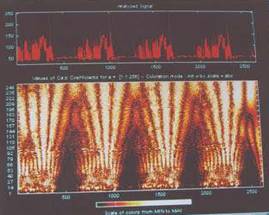
space plot of SSS 111 (BRADY-TACHY) heart rate is shown in Fig.12 and
its CWT is shown in Fig.13. The color variation takes place in sudden
patches of black (brady) and colored (tachy). And the phase space plot
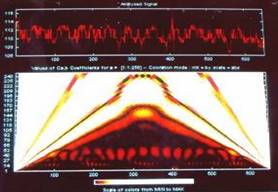
is highly chaotic. The phase space plot of Ischemic /Dilated cardiomyopathy
heart rate is shown in Fig.14 and its CWT is shown in Fig.15. The color
variation is slow and periodic, indicating that the heart rate varies
slowly. And the phase space plot is a very small domain.
Discussion:
The
present study brings out the following important facets of the heart's
function hitherto not studied.
• Heart rate variability is present in all situations even in adults;
it is dampened depending upon the gravity of the disease process.
• Study of the "CHAOS" pattern of HRV gives a better visual
image of the disease state, making it easier to recognize even for an
untrained eye.
• Wavelet analysis gives classical patterns that are unique to different
diseases.
• Fractal structure of the heart is elegantly shown by the self-similarity
seen in normal ECG wavelet analysis, which differentiates the normal from
the abnormal at a glance.
• If the patterns arrived at in this study are shown to be consistent
in a larger study of the patients, cardiac diagnosis could be made even
by a novice in far off village hospitals without hi-tech gadgets available.
Converting the linear data to non-linear format needs the help of complicated mathematical formulae that might look complicated to most medical readers. Since this is the first attempt to understand the working of the dynamic system one has to try to understand the basics that are described in the section on materials and methods. These are all time tested methods and do not require further authentication.
Conclusions:
Heart
rate variability (HRV) is a better measure of the working of the heart,
as it measures many other aspects of the cardiac function compared to
chronotrophicity alone. Non-linear fractal assessment of the HRV represented
graphically gives unique patterns of cardiac abnormalities that makes
diagnosis of the latter easier than by the conventional methods. Pattern
recognition has been made easier still by our study using colour imaging
methods. When this is done on still larger numbers the patterns could
be standardized.
BIBLIOGRAPHY.
1)
Firth WJ. Predicting the unpredictable. BMJ 1991; 303: 1565-68
2) Hegde BM. Chaos- a new concept in science Jr. Assoc. Physi.India 1996;
44: 167-168.
3) Hegde BM Need for change in medical paradigm Proc. Roy. Soll. Physi. Edinb 1993; 9-12.
4)
Wariar. R and Ewaran D. teger coefficient bandpass filter for the simultaneous
removal of baseline wader, 50 and 100 Hz interference from the ECG’,
Medical & Biological Engineering & Computing 1991; 32: 333-336
5) Pan J and Tompkins WJ, Real time RS detector algorithm’, IEEE
Transactions on Biomedical Engineering, 1985; 32: 230-236.
6).
Riouli O and Vettrli M “ Wavelets and Signal Processing”,
IEEE Signal Processing Magazine, 1991; 12:14-38
7). Rao RM and Bopardikar AS ‘Wavelet Transforms Introduction to
theory and applications’, Addison Wesley Ed. Long Man Inc, 1998
8) .Vetterli M and Kovacevic J. Wavelets and Sub-band Coding. Englewood Cliffs, NJ: Prentice-Hall, 1995.
9) .Grossmann A, Martinet RK, and Morlet J "Reading and understanding continuous wavelet transforms" In Wavelets: Time-Frequency Methods and Phase Space. J.M. Combes, A.Grossmann, and Ph. Tchamitchian (eds.), New york, NY: Springer-Verlag, pp 2-20, 2nd edn., 1989/1990.
10) Chui CK. Wavelet Analysis and its Applications. Boston, MA: Acadamic Press,1992.
11) Vetteli M and Herley C "Wavelets and filter banks: theory and design," IEEE Transactions on Signal Processing, 1992; 40: 2207-2232.
12) Mallat S. "A theory for multiresolution signal decomposition: The wavelet representation," IEEE Transactions on Pattern Anal. Machine Intell. 1989; 11: 674-693.
13) Kaplan DK and Cohen JR . "Searching for chaos in fibrillation",
Annals NY Acadamic Science. 1991; 11: 367-374.
14) Cohen ME, Hudson DL, and Deedwania PC. "Applying continuous chaotic modeling to cardiac signal analysis", IEEE Engg. Med. Biol.,1996; 15: 97-102.
15). Dutt ND and Krishnan SM. “Application of Phase space techniques
to the analysis of cardiovascular signals”, Proceedings of IEEE
EMBS Conference, Atlanta, U.S.A.,1999 and Signal Processing, Singapore,
U.S.A.,1999.
16) Fraser AM, Swinney HL, "Independent coordinates for strange attractors from mutual information", Physical Review A, 1986; 33: 1134-1140.
17)
Fraser AM, "Information and entropy in strange attractors",
IEEE transactions on Information Theory, 1989;35: 245-262.
18) Grossberg P. and Procaccia I, "Measuring the strangeness of strange
attractors, " Physica D, 1983; 9: 189-208.
19) Ding M, Grebogi E, Ott E, Sauer T, Yorke JA, "Estimating correlation dimension from a chaotic time series: When a plateau occur ?", Physica D, 1993; 69: 404-424.
DIAGRAMS.
 |
 |
| Fig.2 | Fig.3 CWT plot of Fig.2 |
| . | . |
 |
|
| Fig.4 | Fig.5 CWT plot of Fig.4 |
| . | . |
|
 |
| Fig.6 | Fig.7 CWT plot of Fig.6 |
| . | . |
|
 |
| Fig.8 | Fig.9 CWT plot of Fig.8 |
| . | . |
|
|
| Fig .10 | Fig.11 CWT plot of Fig.10 |
| . | . |
|
 |
| Fig .12 | Fig.13 CWT plot of Fig.12 |
| . | . |
|
 |
| Fig .14 | Fig.14 CWT plot of Fig.14 |
| . | |
| . | |
